On Saturday, October 12th, the Oklahoma Sooners and Texas Longhorns will meet in the Cotton Bowl for the 108th edition ofRed River Rivalry. Unlike many past match-ups, Texas is down this year. With a record of 3-2, and several poor performances, most analysts aren’t expecting the Longhorns to provide much competition for the Sooners. As a Sooners fan, I always try to remain skeptical of such talk.
One of the great improvements this year for Oklahoma is their defense. I began poking around the statistics and noticed that Oklahoma has not faced a team ranked better than 79th in total offense. This was particularly intriguing because Texas is ranked 39th. I began to wonder, beyond the “anything can happen in a rivalry” wild card, if there were any statistics that might point to a closer game than most expect.
First, I looked at the offensive performance by each team: scoring, total yards, passing yards, and rushing yards. I took both team’s output in each game and normalized them by their respective opponent’s average in the category of interest. This value was found by subtracting the opponent’s average from either the Oklahoma or Texas output, and then dividing by the opponent’s average. For instance, if Oklahoma’s opponent surrendered an average of 14 points and the Sooners scored 28, then the normalized value would be unity. The same was done for each team’s defensive performance.
Positive (negative) values indicate a performance that exceeds an opponent’s offensive (defensive) average, while the opposite sign indicates a performance that lags an opponent’s average. In other words, positive (negative) values indicate a “good” offensive (defensive) performance, while negative (positive) values indicate a “bad” offensive (defensive) performance. The relative level of “good” or “bad” increases with increasing magnitude.
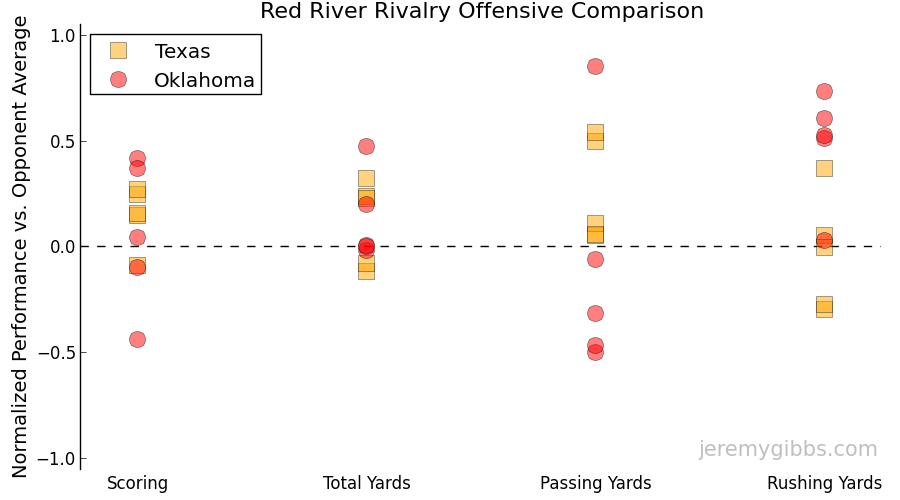
 Offensive production from Texas and Oklahoma. Values are normalized by their opponents' respective average.
In looking at the offensive plot, Texas has more positive scoring performances than Oklahoma (4/5 vs. 3/5), while Oklahoma has the more impressive relative single scoring output. Passing performance illustrates a rather stark difference between Oklahoma and Texas. Outside of the one particularly strong outing from the Sooners, their passing output has been relatively poor when compared to Texas. Generally, the opposite is true for rushing.
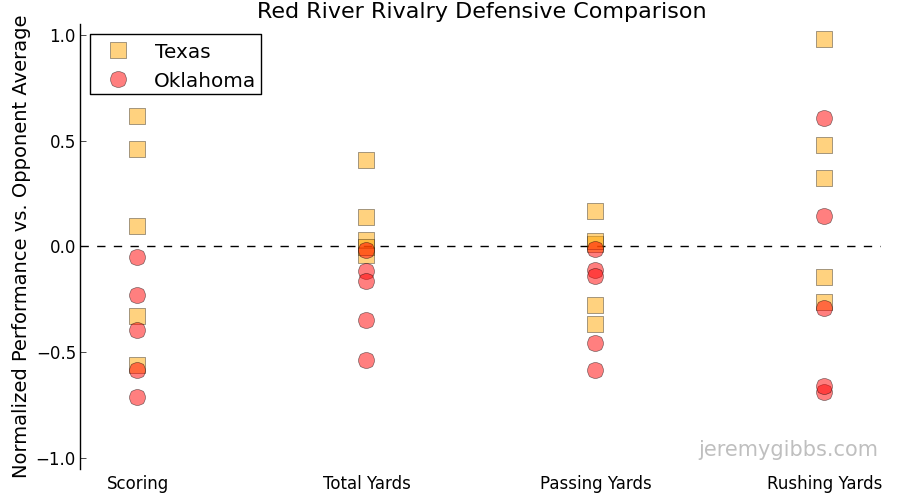
On the defensive side, the Oklahoma Sooners have more impressive defensive outings than Texas in all categories. This is especially evident in scoring and pass defense.
 Defensive production from Texas and Oklahoma. Values are normalized by their opponents' respective average.
However, these figures can be misleading. On offense, the positive (negative) outliers can arise from playing weak (strong) opponents. The opposite is true for defense. To account for this, I added a weighting term to the normalized values that took into account the opponent’s national rank (out of 123 teams) in each respective category. The idea was to penalize each team for poor performances against weak opponents and to reward good performances against strong opponents. The weighting procedure is very ad-hoc1, prescribed for offense as:
weight = 1 - (opponent ranking-1)/123

if (normalizedValue > 0):
	normalizedValue = weight*normalizedValue
else:
	normalizedValue = (1-weight)*normalizedValue
and for defense as:
weight = 1 - (opponent ranking-1)/123

if (normalizedValue > 0):
	normalizedValue = (1-weight)*normalizedValue
else:
	normalizedValue = weight*normalizedValue
The hope in applying a weighting factor is that the spread among data points, and thus the subsequent interpretatios, are more meaningful.
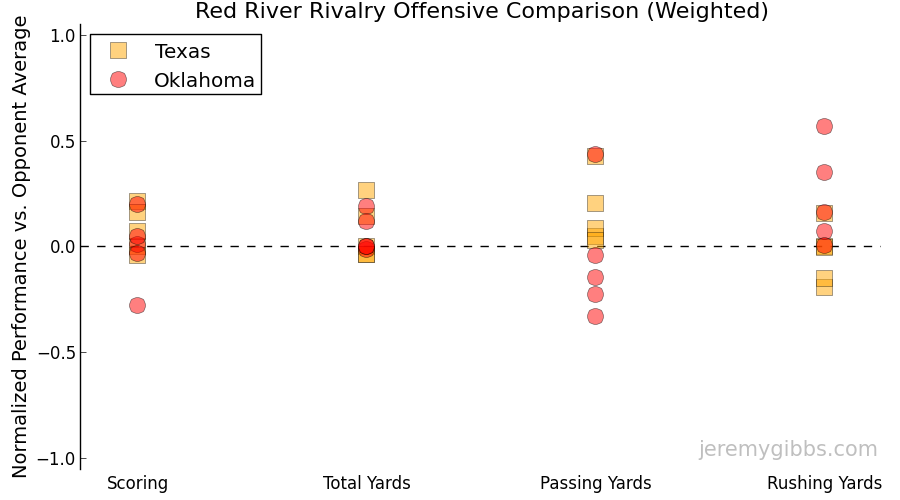
 Offensive production from Texas and Oklahoma. Values are normalized by their opponents' respective average and weighted by their opponents' respective rank.
Indeed, examination of the offensive data shows that the spread of each category is reduced. We see that Oklahoma isn’t a scoring juggernaut like in the days of Sam Bradford and Landry Jones. Comparatively, Texas has performed slightly better than the Sooners. Total yards are fairly similar, while the components of the total are different. Oklahoma’s offense appears to thrive in the running game, while the Longhorn’s offense is driven by passing.
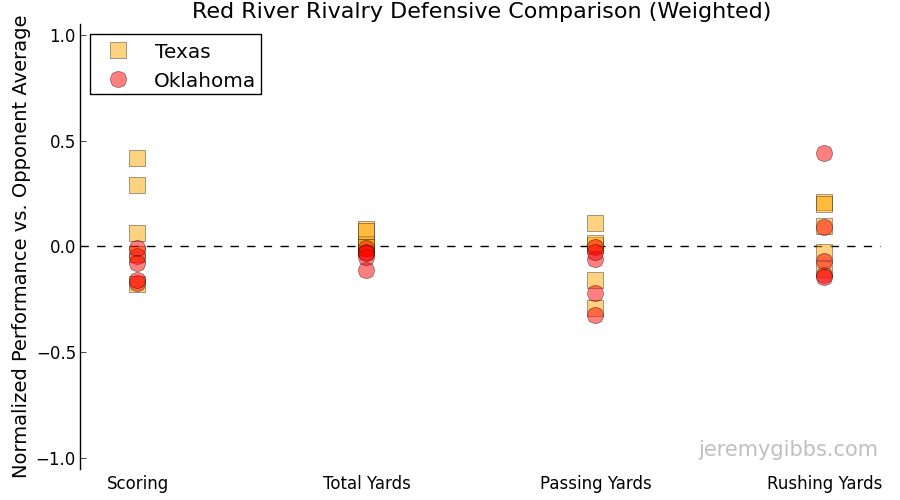
 Defensive production from Texas and Oklahoma. Values are normalized by their opponents' respective average and weighted by their opponents' respective rank.
Likewise, inspection of the weighted defensive data indicates that Oklahoma remains ahead of Texas, although the differences aren’t as drastic as they originally appeared. We see that Oklahoma is largely on the “good” side of each defensive category. A lone exception is the running game, where the Sooners are less consistent. Texas, on the other hand, seems to yield relatively more yards, with the bulk of the damage coming from their opponents running game.
So, where does that leave us? It would seem that the Sooner’s offensive strength plays directly into the Lonhgorn’s defensive weakness. I would expect Texas to attempt making Oklahoma a one-dimensional passing team. Conversely, the Sooner’s defensive strength matches the Longhorn’s offensive strength. I imagine that the Longhorn’s will try and run the ball in an effort to take pressure off of their quarterback.
My bet is that the Sooners shut down the Texas running game and force a few turnovers in the passing game. I also expect the Sooners to have success running the ball. I am picking the Sooners to win, although in a closer game than most expect2.
